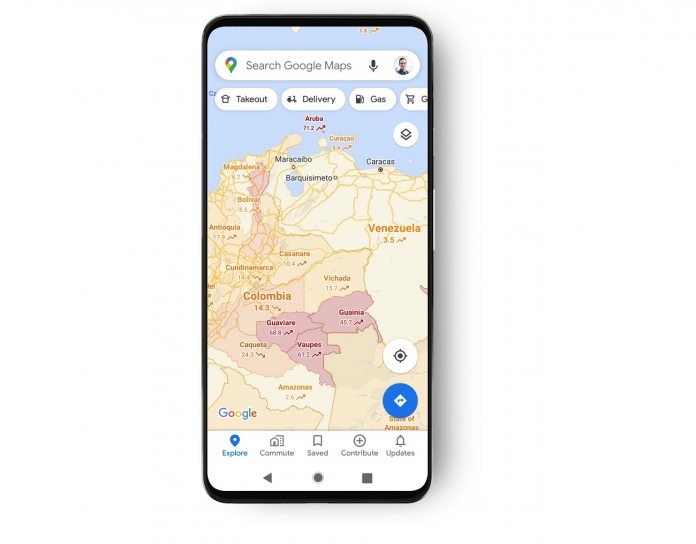
In terms of boosting capabilities in a COVID-19 world, tech companies are both helping users and continuing to differentiate their own services from rivals. We have already seen how Microsoft has leveraged Bing Maps for COVID-related tools. Google Maps is furthering its commitment to tracking COVID-19 data with a new layer available this week. Now, the popular mapping tool will provide critical information on the pandemic in specific areas. According to Google, the new layer will help users have more understanding of the COVID-19 spread in a location before they visit. To achieve this, Google Maps is using a simple color scheme system where different colors show COVID-19 cases by 100,000 people across seven days.
How it Works
Labels show if numbers of cases are increasing or decreasing. Google is tapping into several sources to acquire the data, including Wikipedia, the New York Time, and medical organizations. Those sources obtain information from official government health statistics and groups like the World Health Organization. The new layer in Maps is live this week on iOS and Android, and functions across 220 countries and regions around the world. In fact, Google says the tool is available to all territories that have access to Google Maps. While the core of the feature is country information, there will be data on states, counties, provinces, and cities where possible.